注記
完全なコード例をダウンロードするには、最後まで進んでください。または、Binder経由でブラウザでこの例を実行するには
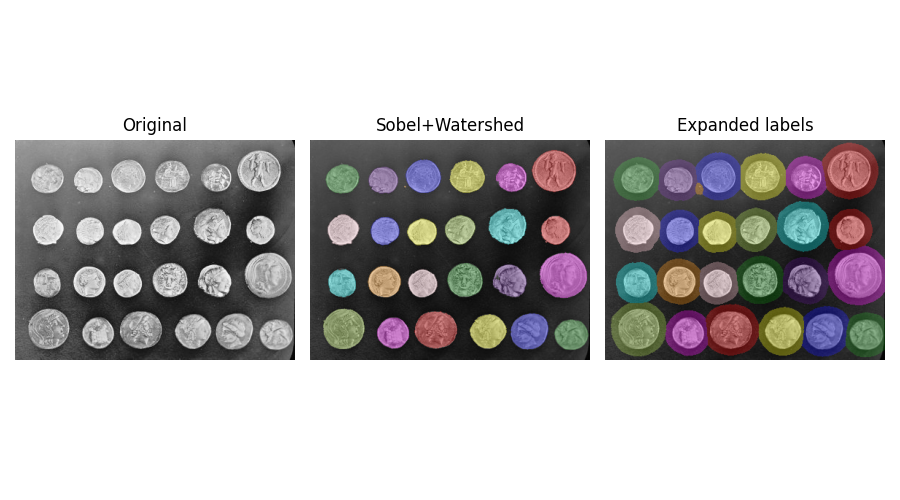
重複なしでセグメンテーションラベルを拡張する#
ラベル画像で表される複数の連結成分が与えられた場合、これらの連結成分はskimage.segmentation.expand_labels()を使用して背景領域に拡張できます。skimage.morphology.dilation()とは対照的に、このメソッドは連結成分がラベル番号の小さい隣接する連結成分に拡張することを許可しません。
import matplotlib.pyplot as plt
import numpy as np
from skimage import data
from skimage.color import label2rgb
from skimage.filters import sobel
from skimage.measure import label
from skimage.segmentation import expand_labels, watershed

coins = data.coins()

# Make segmentation using edge-detection and watershed.
edges = sobel(coins)

# Identify some background and foreground pixels from the intensity values.
# These pixels are used as seeds for watershed.
markers = np.zeros_like(coins)
foreground, background = 1, 2
markers[coins < 30.0] = background
markers[coins > 150.0] = foreground

ws = watershed(edges, markers)
seg1 = label(ws == foreground)

expanded = expand_labels(seg1, distance=10)

# Show the segmentations.
fig, axes = plt.subplots(
    nrows=1,
    ncols=3,
    figsize=(9, 5),
    sharex=True,
    sharey=True,
)

axes[0].imshow(coins, cmap="Greys_r")
axes[0].set_title("Original")

color1 = label2rgb(seg1, image=coins, bg_label=0)
axes[1].imshow(color1)
axes[1].set_title("Sobel+Watershed")

color2 = label2rgb(expanded, image=coins, bg_label=0)
axes[2].imshow(color2)
axes[2].set_title("Expanded labels")

for a in axes:
    a.axis("off")
fig.tight_layout()
plt.show()
**スクリプトの総実行時間:**(0分0.735秒)