ノート
最後に移動して完全なサンプルコードをダウンロードするか、Binder経由でブラウザでこの例を実行してください
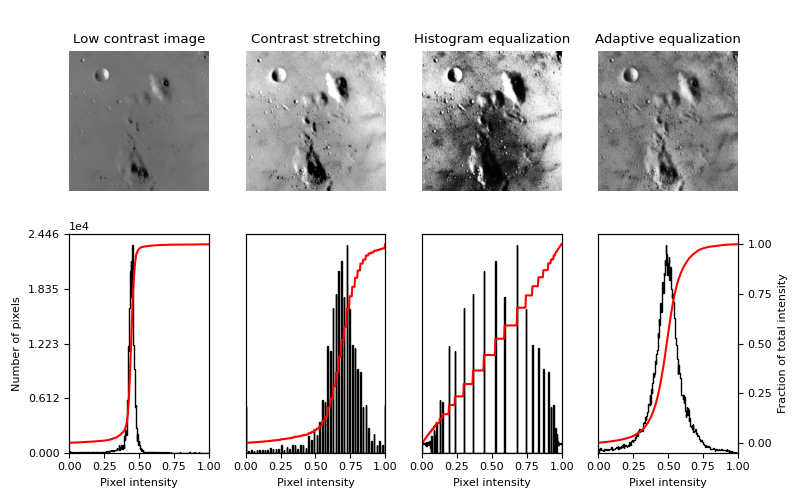
ヒストグラム平坦化#
この例では、ヒストグラム平坦化と呼ばれる手法を使用して、コントラストの低い画像を強調表示します。これは、画像内の「最も頻繁な強度値を拡散」させます[1]。平坦化された画像は、ほぼ線形の累積分布関数を持ちます。
ヒストグラム平坦化にはパラメータが必要ないという利点がありますが、不自然に見える画像になることがあります。代替手法はコントラストストレッチで、画像は2パーセント点と98パーセント点に入るすべての強度を含むようにリスケールされます[2]。
import matplotlib
import matplotlib.pyplot as plt
import numpy as np

from skimage import data, img_as_float
from skimage import exposure


matplotlib.rcParams['font.size'] = 8


def plot_img_and_hist(image, axes, bins=256):
    """Plot an image along with its histogram and cumulative histogram."""
    image = img_as_float(image)
    ax_img, ax_hist = axes
    ax_cdf = ax_hist.twinx()

    # Display image
    ax_img.imshow(image, cmap=plt.cm.gray)
    ax_img.set_axis_off()

    # Display histogram
    ax_hist.hist(image.ravel(), bins=bins, histtype='step', color='black')
    ax_hist.ticklabel_format(axis='y', style='scientific', scilimits=(0, 0))
    ax_hist.set_xlabel('Pixel intensity')
    ax_hist.set_xlim(0, 1)
    ax_hist.set_yticks([])

    # Display cumulative distribution
    img_cdf, bins = exposure.cumulative_distribution(image, bins)
    ax_cdf.plot(bins, img_cdf, 'r')
    ax_cdf.set_yticks([])

    return ax_img, ax_hist, ax_cdf


# Load an example image
img = data.moon()

# Contrast stretching
p2, p98 = np.percentile(img, (2, 98))
img_rescale = exposure.rescale_intensity(img, in_range=(p2, p98))

# Equalization
img_eq = exposure.equalize_hist(img)

# Adaptive Equalization
img_adapteq = exposure.equalize_adapthist(img, clip_limit=0.03)

# Display results
fig = plt.figure(figsize=(8, 5))
axes = np.zeros((2, 4), dtype=object)
axes[0, 0] = fig.add_subplot(2, 4, 1)
for i in range(1, 4):
    axes[0, i] = fig.add_subplot(2, 4, 1 + i, sharex=axes[0, 0], sharey=axes[0, 0])
for i in range(0, 4):
    axes[1, i] = fig.add_subplot(2, 4, 5 + i)

ax_img, ax_hist, ax_cdf = plot_img_and_hist(img, axes[:, 0])
ax_img.set_title('Low contrast image')

y_min, y_max = ax_hist.get_ylim()
ax_hist.set_ylabel('Number of pixels')
ax_hist.set_yticks(np.linspace(0, y_max, 5))

ax_img, ax_hist, ax_cdf = plot_img_and_hist(img_rescale, axes[:, 1])
ax_img.set_title('Contrast stretching')

ax_img, ax_hist, ax_cdf = plot_img_and_hist(img_eq, axes[:, 2])
ax_img.set_title('Histogram equalization')

ax_img, ax_hist, ax_cdf = plot_img_and_hist(img_adapteq, axes[:, 3])
ax_img.set_title('Adaptive equalization')

ax_cdf.set_ylabel('Fraction of total intensity')
ax_cdf.set_yticks(np.linspace(0, 1, 5))

# prevent overlap of y-axis labels
fig.tight_layout()
plt.show()
スクリプトの合計実行時間:(0分1.214秒)