注記
最後へ移動して、完全なサンプルコードをダウンロードするか、Binderを介してブラウザでこの例を実行してください
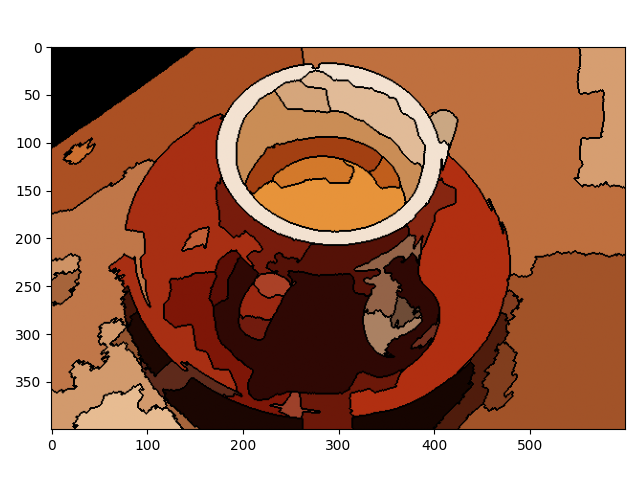
領域隣接グラフ (RAG) のマージ#
この例では、領域隣接グラフ(RAG)を構築し、色の類似性が高い領域を徐々にマージします。2つの隣接する領域をマージすると、マージされた領域からのすべてのピクセルを持つ新しい領域が生成されます。領域は、非常に類似した領域ペアがなくなるまでマージされます。
from skimage import data, segmentation, color
from skimage import graph
import numpy as np
import matplotlib.pyplot as plt


def _weight_mean_color(graph, src, dst, n):
    """Callback to handle merging nodes by recomputing mean color.

    The method expects that the mean color of `dst` is already computed.

    Parameters
    ----------
    graph : RAG
        The graph under consideration.
    src, dst : int
        The vertices in `graph` to be merged.
    n : int
        A neighbor of `src` or `dst` or both.

    Returns
    -------
    data : dict
        A dictionary with the `"weight"` attribute set as the absolute
        difference of the mean color between node `dst` and `n`.
    """

    diff = graph.nodes[dst]['mean color'] - graph.nodes[n]['mean color']
    diff = np.linalg.norm(diff)
    return {'weight': diff}


def merge_mean_color(graph, src, dst):
    """Callback called before merging two nodes of a mean color distance graph.

    This method computes the mean color of `dst`.

    Parameters
    ----------
    graph : RAG
        The graph under consideration.
    src, dst : int
        The vertices in `graph` to be merged.
    """
    graph.nodes[dst]['total color'] += graph.nodes[src]['total color']
    graph.nodes[dst]['pixel count'] += graph.nodes[src]['pixel count']
    graph.nodes[dst]['mean color'] = (
        graph.nodes[dst]['total color'] / graph.nodes[dst]['pixel count']
    )


img = data.coffee()
labels = segmentation.slic(img, compactness=30, n_segments=400, start_label=1)
g = graph.rag_mean_color(img, labels)

labels2 = graph.merge_hierarchical(
    labels,
    g,
    thresh=35,
    rag_copy=False,
    in_place_merge=True,
    merge_func=merge_mean_color,
    weight_func=_weight_mean_color,
)

out = color.label2rgb(labels2, img, kind='avg', bg_label=0)
out = segmentation.mark_boundaries(out, labels2, (0, 0, 0))

fig, ax = plt.subplots()
ax.imshow(out)
plt.tight_layout()
plt.show()
スクリプトの合計実行時間: (0 分 4.305 秒)