注記
完全なサンプルコードをダウンロードするには、ここをクリックしてください。 または、Binder経由でブラウザでこの例を実行します。
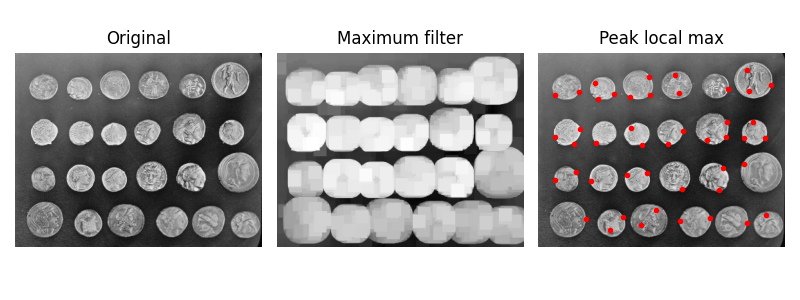
局所最大値の検出#
peak_local_max関数は、画像内の局所的なピーク(最大値)の座標を返します。内部的には、局所最大値の検出に最大フィルタが使用されます。この操作は元の画像を膨張させ、拡張のサイズよりも近い隣接する局所最大値をマージします。元の画像が拡張された画像と等しい場所は、局所最大値として返されます。
from scipy import ndimage as ndi
import matplotlib.pyplot as plt
from skimage.feature import peak_local_max
from skimage import data, img_as_float

im = img_as_float(data.coins())

# image_max is the dilation of im with a 20*20 structuring element
# It is used within peak_local_max function
image_max = ndi.maximum_filter(im, size=20, mode='constant')

# Comparison between image_max and im to find the coordinates of local maxima
coordinates = peak_local_max(im, min_distance=20)

# display results
fig, axes = plt.subplots(1, 3, figsize=(8, 3), sharex=True, sharey=True)
ax = axes.ravel()
ax[0].imshow(im, cmap=plt.cm.gray)
ax[0].axis('off')
ax[0].set_title('Original')

ax[1].imshow(image_max, cmap=plt.cm.gray)
ax[1].axis('off')
ax[1].set_title('Maximum filter')

ax[2].imshow(im, cmap=plt.cm.gray)
ax[2].autoscale(False)
ax[2].plot(coordinates[:, 1], coordinates[:, 0], 'r.')
ax[2].axis('off')
ax[2].set_title('Peak local max')

fig.tight_layout()

plt.show()
スクリプトの実行時間合計:(0分0.526秒)