注意
最後に移動して完全なサンプルコードをダウンロードするか、Binder経由でブラウザでこのサンプルを実行してください
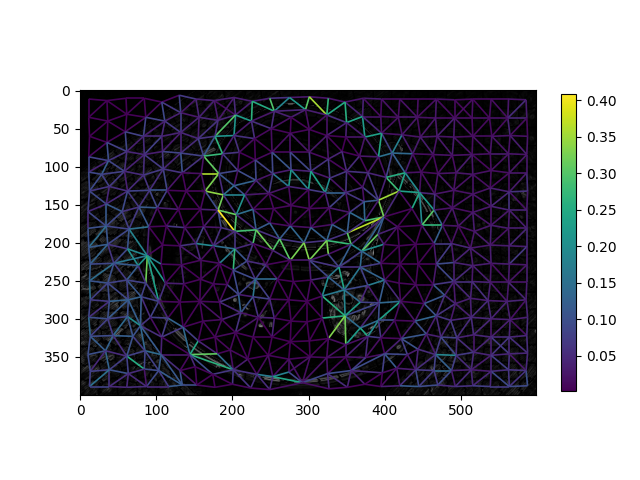
領域境界に基づく領域隣接グラフ (RAG)#
rag_boundary 関数を使用して領域境界RAGを構築します。関数 skimage.graph.rag_boundary() は、各ピクセルに存在する特徴(エッジなど)の重要度を示す edge_map 引数を取ります。領域境界RAGでは、2つの領域間のエッジの重みは、それらの共有境界に沿った edge_map 内の対応するピクセルの平均値です。
from skimage import graph
from skimage import data, segmentation, color, filters
from matplotlib import pyplot as plt


img = data.coffee()
gimg = color.rgb2gray(img)

labels = segmentation.slic(img, compactness=30, n_segments=400, start_label=1)
edges = filters.sobel(gimg)
edges_rgb = color.gray2rgb(edges)

g = graph.rag_boundary(labels, edges)
lc = graph.show_rag(
    labels, g, edges_rgb, img_cmap=None, edge_cmap='viridis', edge_width=1.2
)

plt.colorbar(lc, fraction=0.03)
plt.show()
スクリプトの合計実行時間:(0分1.169秒)