注
最後へ移動して、完全なサンプルコードをダウンロードします。または、Binderを介してブラウザでこの例を実行します。
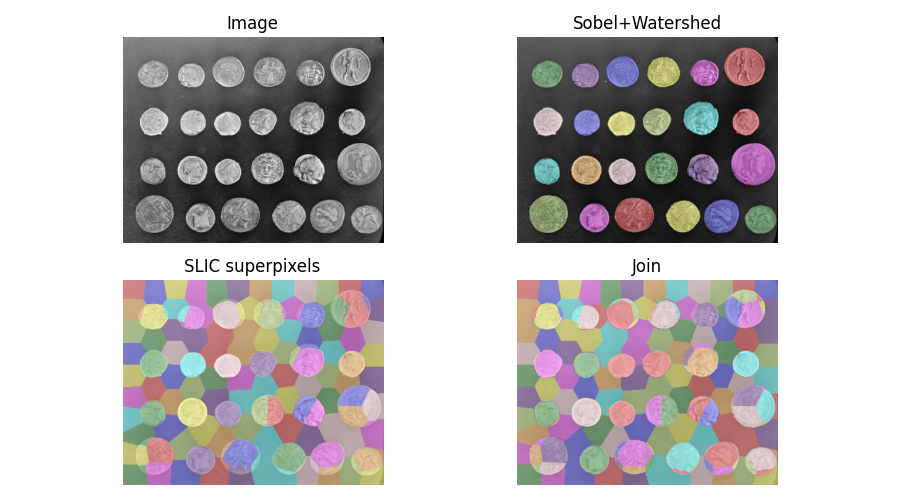
2つのセグメンテーションの交差を見つける#
画像をセグメント化するとき、複数の代替セグメンテーションを組み合わせたい場合があります。skimage.segmentation.join_segmentations()関数は、2つのセグメンテーションの結合を計算します。この結合では、ピクセルは、両方のセグメンテーションで同じセグメントにある場合にのみ、同じセグメントに配置されます。
import numpy as np
import matplotlib.pyplot as plt

from skimage.filters import sobel
from skimage.measure import label
from skimage.segmentation import slic, join_segmentations, watershed
from skimage.color import label2rgb
from skimage import data

coins = data.coins()

# Make segmentation using edge-detection and watershed.
edges = sobel(coins)

# Identify some background and foreground pixels from the intensity values.
# These pixels are used as seeds for watershed.
markers = np.zeros_like(coins)
foreground, background = 1, 2
markers[coins < 30.0] = background
markers[coins > 150.0] = foreground

ws = watershed(edges, markers)
seg1 = label(ws == foreground)

# Make segmentation using SLIC superpixels.
seg2 = slic(
    coins,
    n_segments=117,
    max_num_iter=160,
    sigma=1,
    compactness=0.75,
    channel_axis=None,
    start_label=0,
)

# Combine the two.
segj = join_segmentations(seg1, seg2)

# Show the segmentations.
fig, axes = plt.subplots(ncols=2, nrows=2, figsize=(9, 5), sharex=True, sharey=True)
ax = axes.ravel()
ax[0].imshow(coins, cmap='gray')
ax[0].set_title('Image')

color1 = label2rgb(seg1, image=coins, bg_label=0)
ax[1].imshow(color1)
ax[1].set_title('Sobel+Watershed')

color2 = label2rgb(seg2, image=coins, image_alpha=0.5, bg_label=-1)
ax[2].imshow(color2)
ax[2].set_title('SLIC superpixels')

color3 = label2rgb(segj, image=coins, image_alpha=0.5, bg_label=-1)
ax[3].imshow(color3)
ax[3].set_title('Join')

for a in ax:
    a.axis('off')
fig.tight_layout()
plt.show()
スクリプトの合計実行時間:(0分2.590秒)