注
最後に移動して、完全なサンプルコードをダウンロードするか、Binderを介してブラウザーでこの例を実行してください。
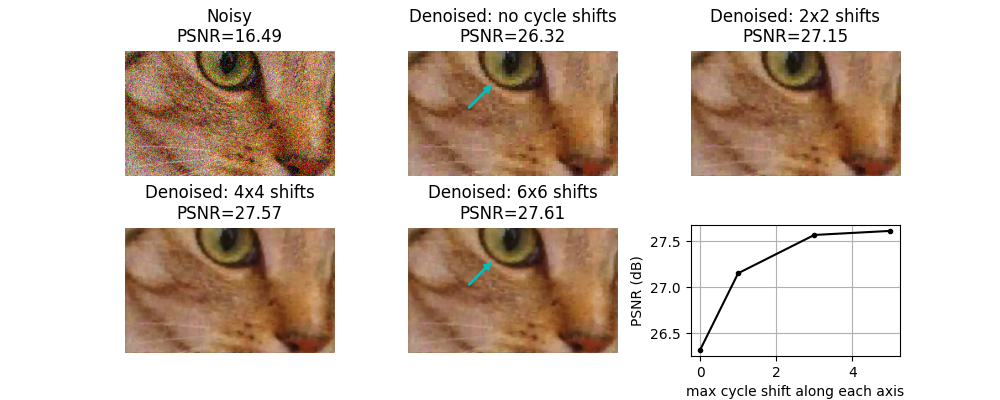
シフト不変ウェーブレットノイズ除去#
離散ウェーブレット変換はシフト不変ではありません。シフト不変性は、非間引きウェーブレット変換(定常ウェーブレット変換とも呼ばれます)を通じて達成できますが、冗長性が増加します(つまり、入力画像のピクセル数よりも多くのウェーブレット係数)。離散ウェーブレット変換を使用した画像ノイズ除去のコンテキストでシフト不変性を近似する別の方法は、「サイクルスピニング」として知られる手法を使用することです。これには、複数の空間シフトnについて、次の3段階の手順の結果を平均することが含まれます。
信号を量nだけ(円形に)シフトします
ノイズ除去を適用します
逆シフトを適用します
2D画像ノイズ除去の場合、ここでは、このようなサイクルスピニングにより品質が大幅に向上する可能性があり、各軸でn=0とn=1のシフトを平均するだけで、そのゲインの大部分が得られることを示します。
Clipping input data to the valid range for imshow with RGB data ([0..1] for floats or [0..255] for integers). Got range [-0.020569158406717254..0.8458827689308539].
import matplotlib.pyplot as plt

from skimage.restoration import denoise_wavelet, cycle_spin
from skimage import data, img_as_float
from skimage.util import random_noise
from skimage.metrics import peak_signal_noise_ratio


original = img_as_float(data.chelsea()[100:250, 50:300])

sigma = 0.155
noisy = random_noise(original, var=sigma**2)

fig, ax = plt.subplots(nrows=2, ncols=3, figsize=(10, 4), sharex=False, sharey=False)
ax = ax.ravel()

psnr_noisy = peak_signal_noise_ratio(original, noisy)
ax[0].imshow(noisy)
ax[0].axis('off')
ax[0].set_title(f'Noisy\nPSNR={psnr_noisy:0.4g}')


# Repeat denosing with different amounts of cycle spinning.  e.g.
# max_shift = 0 -> no cycle spinning
# max_shift = 1 -> shifts of (0, 1) along each axis
# max_shift = 3 -> shifts of (0, 1, 2, 3) along each axis
# etc...

denoise_kwargs = dict(
    channel_axis=-1, convert2ycbcr=True, wavelet='db1', rescale_sigma=True
)

all_psnr = []
max_shifts = [0, 1, 3, 5]
for n, s in enumerate(max_shifts):
    im_bayescs = cycle_spin(
        noisy,
        func=denoise_wavelet,
        max_shifts=s,
        func_kw=denoise_kwargs,
        channel_axis=-1,
    )
    ax[n + 1].imshow(im_bayescs)
    ax[n + 1].axis('off')
    psnr = peak_signal_noise_ratio(original, im_bayescs)
    if s == 0:
        ax[n + 1].set_title(f'Denoised: no cycle shifts\nPSNR={psnr:0.4g}')
    else:
        ax[n + 1].set_title(f'Denoised: {s+1}x{s+1} shifts\nPSNR={psnr:0.4g}')
    all_psnr.append(psnr)

# plot PSNR as a function of the degree of cycle shifting
ax[5].plot(max_shifts, all_psnr, 'k.-')
ax[5].set_ylabel('PSNR (dB)')
ax[5].set_xlabel('max cycle shift along each axis')
ax[5].grid(True)
plt.subplots_adjust(wspace=0.35, hspace=0.35)

# Annotate with a cyan arrow on the 6x6 case vs. no cycle shift case to
# illustrate a region with reduced block-like artifact with cycle shifting
arrowprops = dict(
    arrowstyle="simple,tail_width=0.1,head_width=0.5", connectionstyle="arc3", color='c'
)
for i in [1, 4]:
    ax[i].annotate(
        "",
        xy=(101, 39),
        xycoords='data',
        xytext=(70, 70),
        textcoords='data',
        arrowprops=arrowprops,
    )

plt.show()
スクリプトの総実行時間:(0分1.410秒)