注
最後に移動して、完全なサンプルコードをダウンロードするか、Binder経由でブラウザでこの例を実行してください
領域隣接グラフ(RAG)#
この例では、領域隣接グラフ(RAG)のmerge_nodes関数の使用法を示します。RAGクラスは、networkx.Graphクラスから継承された無向重み付きグラフを表します。2つのノードをマージして新しいノードが形成されると、結果のノードに接続されているすべてのエッジの重みは、ユーザー定義の関数weight_funcによって更新できます。
デフォルトの動作は、競合が発生した場合に小さいエッジの重みを使用することです。以下の例では、代わりにカスタム関数を使用して大きい重みを選択する方法も示しています。
import skimage as ski
import networkx as nx
from matplotlib import pyplot as plt
import numpy as np
def max_edge(g, src, dst, n):
"""Callback to handle merging nodes by choosing maximum weight.
Returns a dictionary with `"weight"` set as either the weight between
(`src`, `n`) or (`dst`, `n`) in `g` or the maximum of the two when
both exist.
Parameters
----------
g : RAG
The graph under consideration.
src, dst : int
The vertices in `g` to be merged.
n : int
A neighbor of `src` or `dst` or both.
Returns
-------
data : dict
A dict with the "weight" attribute set the weight between
(`src`, `n`) or (`dst`, `n`) in `g` or the maximum of the two when
both exist.
"""
w1 = g[n].get(src, {'weight': -np.inf})['weight']
w2 = g[n].get(dst, {'weight': -np.inf})['weight']
return {'weight': max(w1, w2)}
def display(g, title):
"""Displays a graph with the given title."""
pos = nx.circular_layout(g)
plt.figure()
plt.title(title)
nx.draw(g, pos)
nx.draw_networkx_labels(g, pos)
nx.draw_networkx_edge_labels(g, pos, font_size=20)
g = ski.graph.RAG()
g.add_edge(1, 2, weight=10)
g.add_edge(2, 3, weight=20)
g.add_edge(3, 4, weight=30)
g.add_edge(4, 1, weight=40)
g.add_edge(1, 3, weight=50)
# Assigning dummy labels.
for n in g.nodes():
g.nodes[n]['labels'] = [n]
gc = g.copy()
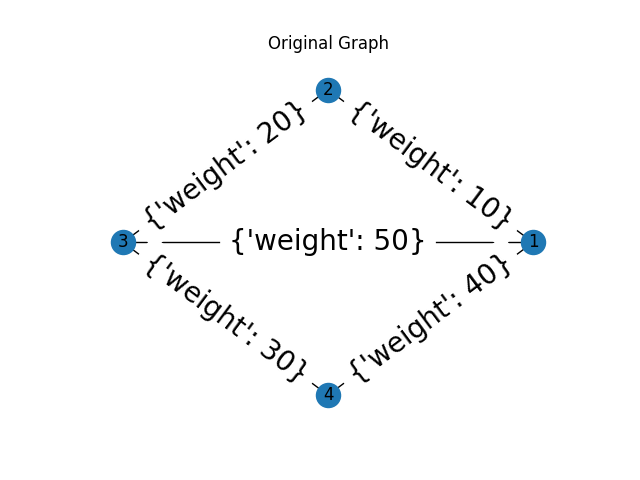
display(g, "Original Graph")
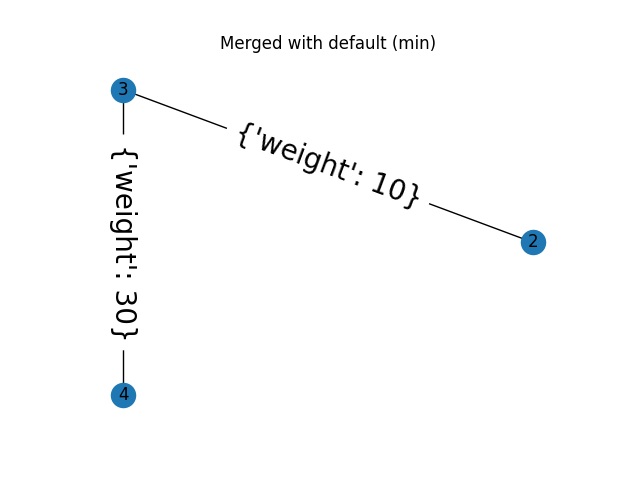
g.merge_nodes(1, 3)
display(g, "Merged with default (min)")
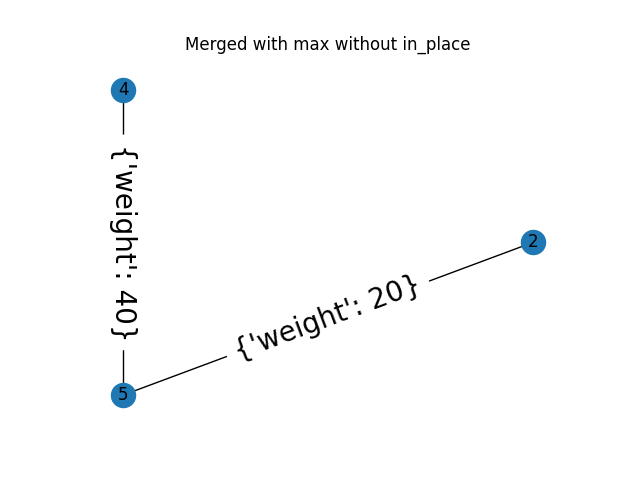
gc.merge_nodes(1, 3, weight_func=max_edge, in_place=False)
display(gc, "Merged with max without in_place")
plt.show()
スクリプトの合計実行時間:(0分0.559秒)