注記
完全なサンプルコードをダウンロードするには、こちらへ。または、Binder経由でブラウザでこの例を実行します。
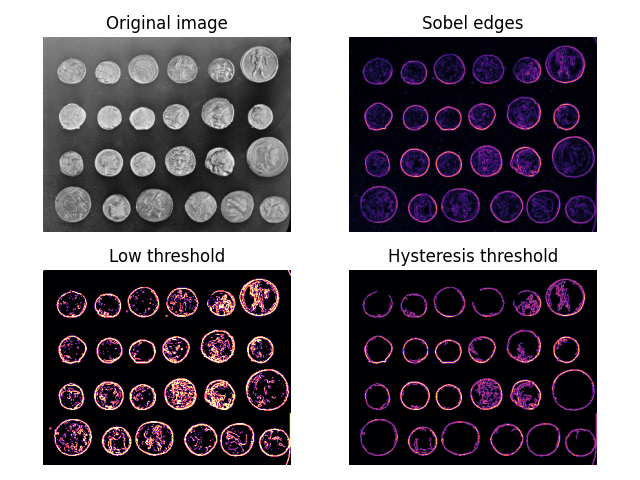
ヒステリシス閾値処理#
ヒステリシスとは、効果の遅れ—一種の慣性—です。閾値処理の文脈では、ある低い閾値を超える領域は、より厳格な高い閾値を超える領域に接続されている場合、その閾値を超えていると見なされることを意味します。したがって、これらは高信頼度の領域の継続として見ることができます。
以下では、通常の閾値処理とヒステリシス閾値処理を比較します。ヒステリシスにより、コインのエッジの外側の「ノイズ」を無視できることに注目してください。
import matplotlib.pyplot as plt
from skimage import data, filters

fig, ax = plt.subplots(nrows=2, ncols=2)

image = data.coins()
edges = filters.sobel(image)

low = 0.1
high = 0.35

lowt = (edges > low).astype(int)
hight = (edges > high).astype(int)
hyst = filters.apply_hysteresis_threshold(edges, low, high)

ax[0, 0].imshow(image, cmap='gray')
ax[0, 0].set_title('Original image')

ax[0, 1].imshow(edges, cmap='magma')
ax[0, 1].set_title('Sobel edges')

ax[1, 0].imshow(lowt, cmap='magma')
ax[1, 0].set_title('Low threshold')

ax[1, 1].imshow(hight + hyst, cmap='magma')
ax[1, 1].set_title('Hysteresis threshold')

for a in ax.ravel():
    a.axis('off')

plt.tight_layout()

plt.show()
スクリプトの総実行時間:(0分0.651秒)