注記
最後まで移動して、完全なサンプルコードをダウンロードします。または、Binder経由でブラウザでこの例を実行します。
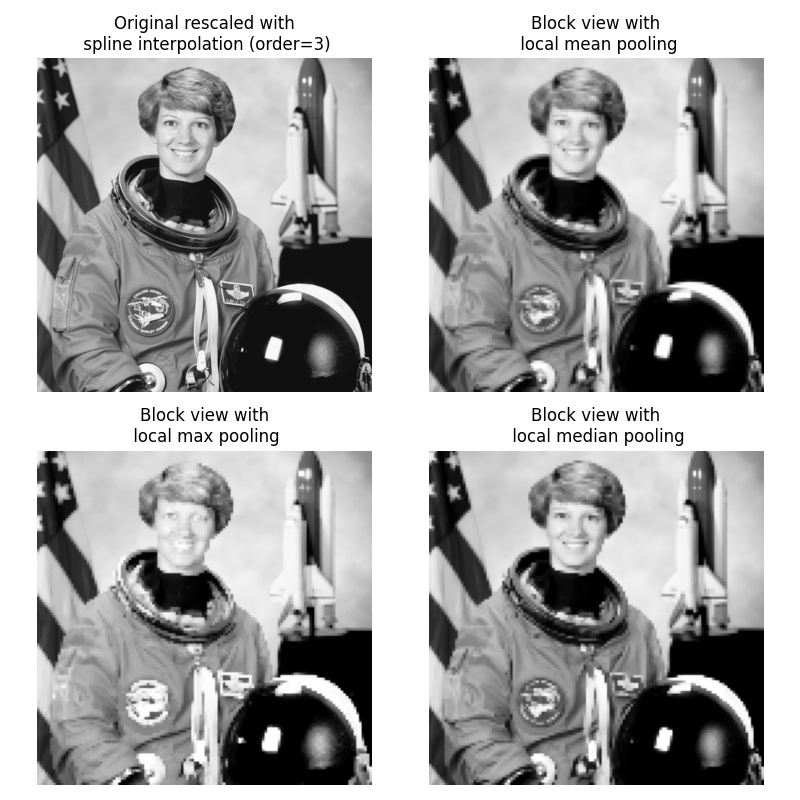
画像/配列のブロックビュー#
この例は、skimage.util()からのview_as_blocksの使用を示しています。ブロックビューは、重なり合わない画像パッチに対して局所的な操作を実行したい場合に非常に役立ちます。
ここでは、skimage.dataからのastronautを使用して、それを仮想的に正方形のブロックに「スライス」します。次に、各ブロックで、そのブロックの平均値、最大値、または中央値をプールします。結果は、元のastronaut画像の3次スプライン補間によるリスケーリングとともに、まとめて表示されます。
import numpy as np
from scipy import ndimage as ndi
from matplotlib import pyplot as plt
import matplotlib.cm as cm

from skimage import data
from skimage import color
from skimage.util import view_as_blocks


# get astronaut from skimage.data in grayscale
l = color.rgb2gray(data.astronaut())

# size of blocks
block_shape = (4, 4)

# see astronaut as a matrix of blocks (of shape block_shape)
view = view_as_blocks(l, block_shape)

# collapse the last two dimensions in one
flatten_view = view.reshape(view.shape[0], view.shape[1], -1)

# resampling the image by taking either the `mean`,
# the `max` or the `median` value of each blocks.
mean_view = np.mean(flatten_view, axis=2)
max_view = np.max(flatten_view, axis=2)
median_view = np.median(flatten_view, axis=2)

# display resampled images
fig, axes = plt.subplots(2, 2, figsize=(8, 8), sharex=True, sharey=True)
ax = axes.ravel()

l_resized = ndi.zoom(l, 2, order=3)
ax[0].set_title("Original rescaled with\n spline interpolation (order=3)")
ax[0].imshow(l_resized, extent=(-0.5, 128.5, 128.5, -0.5), cmap=cm.Greys_r)

ax[1].set_title("Block view with\n local mean pooling")
ax[1].imshow(mean_view, cmap=cm.Greys_r)

ax[2].set_title("Block view with\n local max pooling")
ax[2].imshow(max_view, cmap=cm.Greys_r)

ax[3].set_title("Block view with\n local median pooling")
ax[3].imshow(median_view, cmap=cm.Greys_r)

for a in ax:
    a.set_axis_off()

fig.tight_layout()
plt.show()
スクリプトの実行時間合計:(0分0.919秒)